
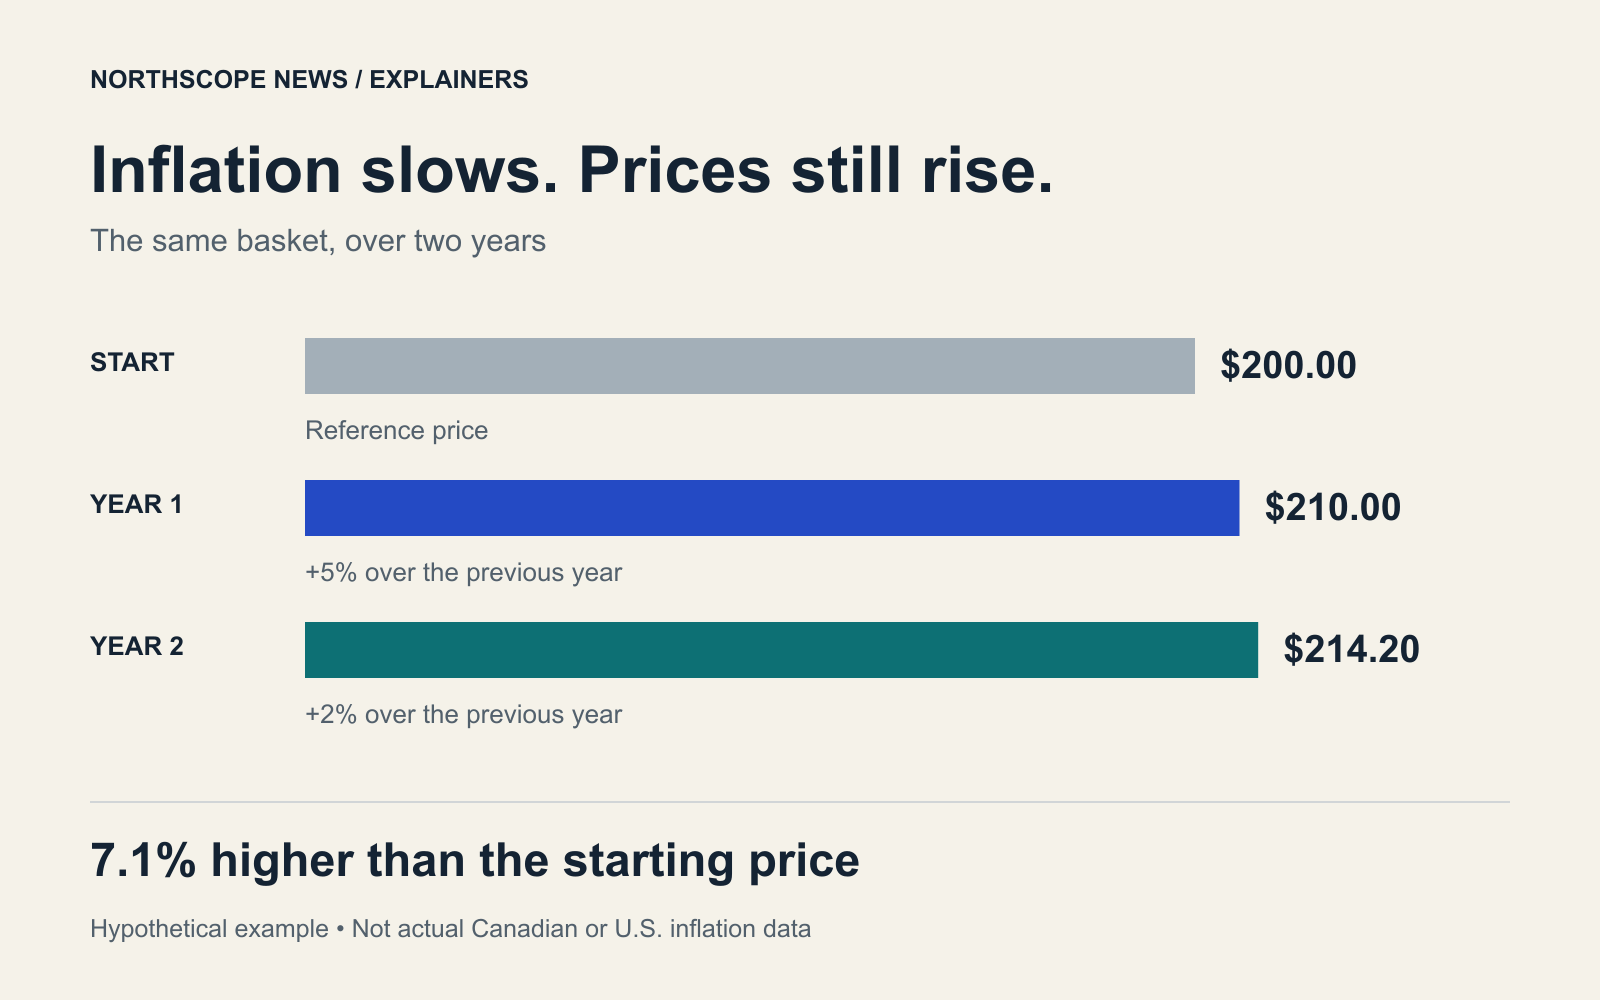
Original NorthScope News graphic. Hypothetical calculations; not observed inflation data. All bars start at zero.
Falling inflation usually means prices are rising more slowly. It does not mean earlier increases have been reversed. When inflation stays positive, the average price level continues to climb—even if the inflation rate falls sharply.
That is how a promising inflation headline and an expensive supermarket visit can both be true. One describes the pace of change; the other reflects the amount you must pay.
A $200 basket makes the difference clear
Imagine buying exactly the same basket of goods at three points in time. The figures below are hypothetical, not Canadian or U.S. inflation readings. The currency does not affect the calculation.
| Point in time | Price change | Basket cost |
|---|---|---|
| Start | Reference price | $200.00 |
| Year 1 | +5% from the start | $210.00 |
| Year 2 | +2% from year one | $214.20 |
Inflation falls from 5% in the first year to 2% in the second, but the basket becomes another $4.20 more expensive. It ends $14.20, or 7.1%, above the original price. Adding 5% and 2% gives only an approximation: the second increase applies to the already higher price.
For that basket to return from $214.20 to $200, its price would have to fall by about 6.6%. Slower growth cannot do that on its own.
Inflation, disinflation and deflation
- Inflation: an increase in the overall price level over a period.
- Disinflation: a slowdown in inflation. In the example above, the annual increase eases from 5% to 2%.
- Deflation: a sustained decline in the overall price level. A sale on one product is not enough to establish economy-wide deflation.
These distinctions are explained in the Bank of Canada’s inflation guide. At zero inflation over a given period, the average price level would be unchanged over that period. It would not automatically return to its level several years earlier.
Why your grocery bill can differ from headline inflation
Headline consumer inflation covers a broad range of goods and services, not just groceries. Statistics Canada gives items different weights according to spending patterns, so a change in a major expense affects the overall index more than the same percentage change in a small expense. The basket is updated to reflect changing consumption. See Statistics Canada’s CPI explanation.
In the United States, the Bureau of Labor Statistics also cautions that a national average does not describe every household. Someone who spends more of their budget on a fast-rising category can experience greater pressure than the headline number suggests. Read the BLS explanation of household differences.
Consider two hypothetical households with the same income. One spends heavily on rent and transit; the other on a mortgage and gasoline. Even if they shop at the same supermarket, their overall exposure to changing prices is different. The national figure is a benchmark, not a personalized bill.
Your checkout total also reflects quantities and choices. Buying more items, changing brands or buying a smaller package affects the comparison. Statistical agencies aim to measure price changes for equivalent quantities and quality; Statistics Canada describes how it adjusts for changes in product size. See its explanation of quantity and quality adjustments.
A yearly slowdown can coexist with a monthly increase
A year-over-year figure compares the index with the same month a year earlier. A month-over-month figure compares it with the previous month. They answer different questions. Seasonal adjustment can also change the comparison by accounting for recurring seasonal patterns. Statistics Canada defines these measures.
For a separate hypothetical example, suppose a price index reads 100 in January of year one, then 104 in February. In year two it reads 108 in January and 109 in February. Annual inflation slows from 8% in January to about 4.8% in February—even though the index rises from 108 to 109 during the month.
The comparison point has changed: February is measured against last year’s higher February reading. That arithmetic is why the year-earlier price level matters, alongside what happened most recently. These invented index values illustrate the calculation; they are not an economic forecast.
Does lower inflation make life more affordable?
Lower inflation reduces the speed at which purchasing power is eroded, but affordability also depends on income. If the example basket rises 7.1% while a household’s income is unchanged, that basket takes a larger share of its budget. If income rises faster than the basket, the comparison improves. The Bank of Canada discusses the strain when incomes fail to keep pace with prices. Read its explanation of purchasing power.
A broad inflation rate alone cannot tell you whether a particular household is better off. Its housing arrangements, spending mix, income and accumulated costs all matter.
Four questions to ask about an inflation headline
- Is it comparing this month with last month, or with the same month last year?
- Does it describe all items, groceries, shelter or another specific category?
- Is the article describing a slower increase, stable prices or an actual decline?
- What has happened to the price level over the period relevant to your budget?
For how inflation influences policy, read Bank of Canada vs. Federal Reserve: who sets interest rates? You can also compare the concepts with our report on Canada’s August 2026 inflation figures.
Sources and calculations
The definitions and measurement discussion draw on the Bank of Canada, Statistics Canada and U.S. Bureau of Labor Statistics sources linked above. The basket and index examples are original, hypothetical calculations, rounded where stated. They do not measure actual household inflation.
How this guide was prepared: AI-assisted writing and original graphics, checked against the official sources linked in the text on September 28, 2026. This is a source-based explainer, not original reporting. Read our editorial standards or report a correction.

